
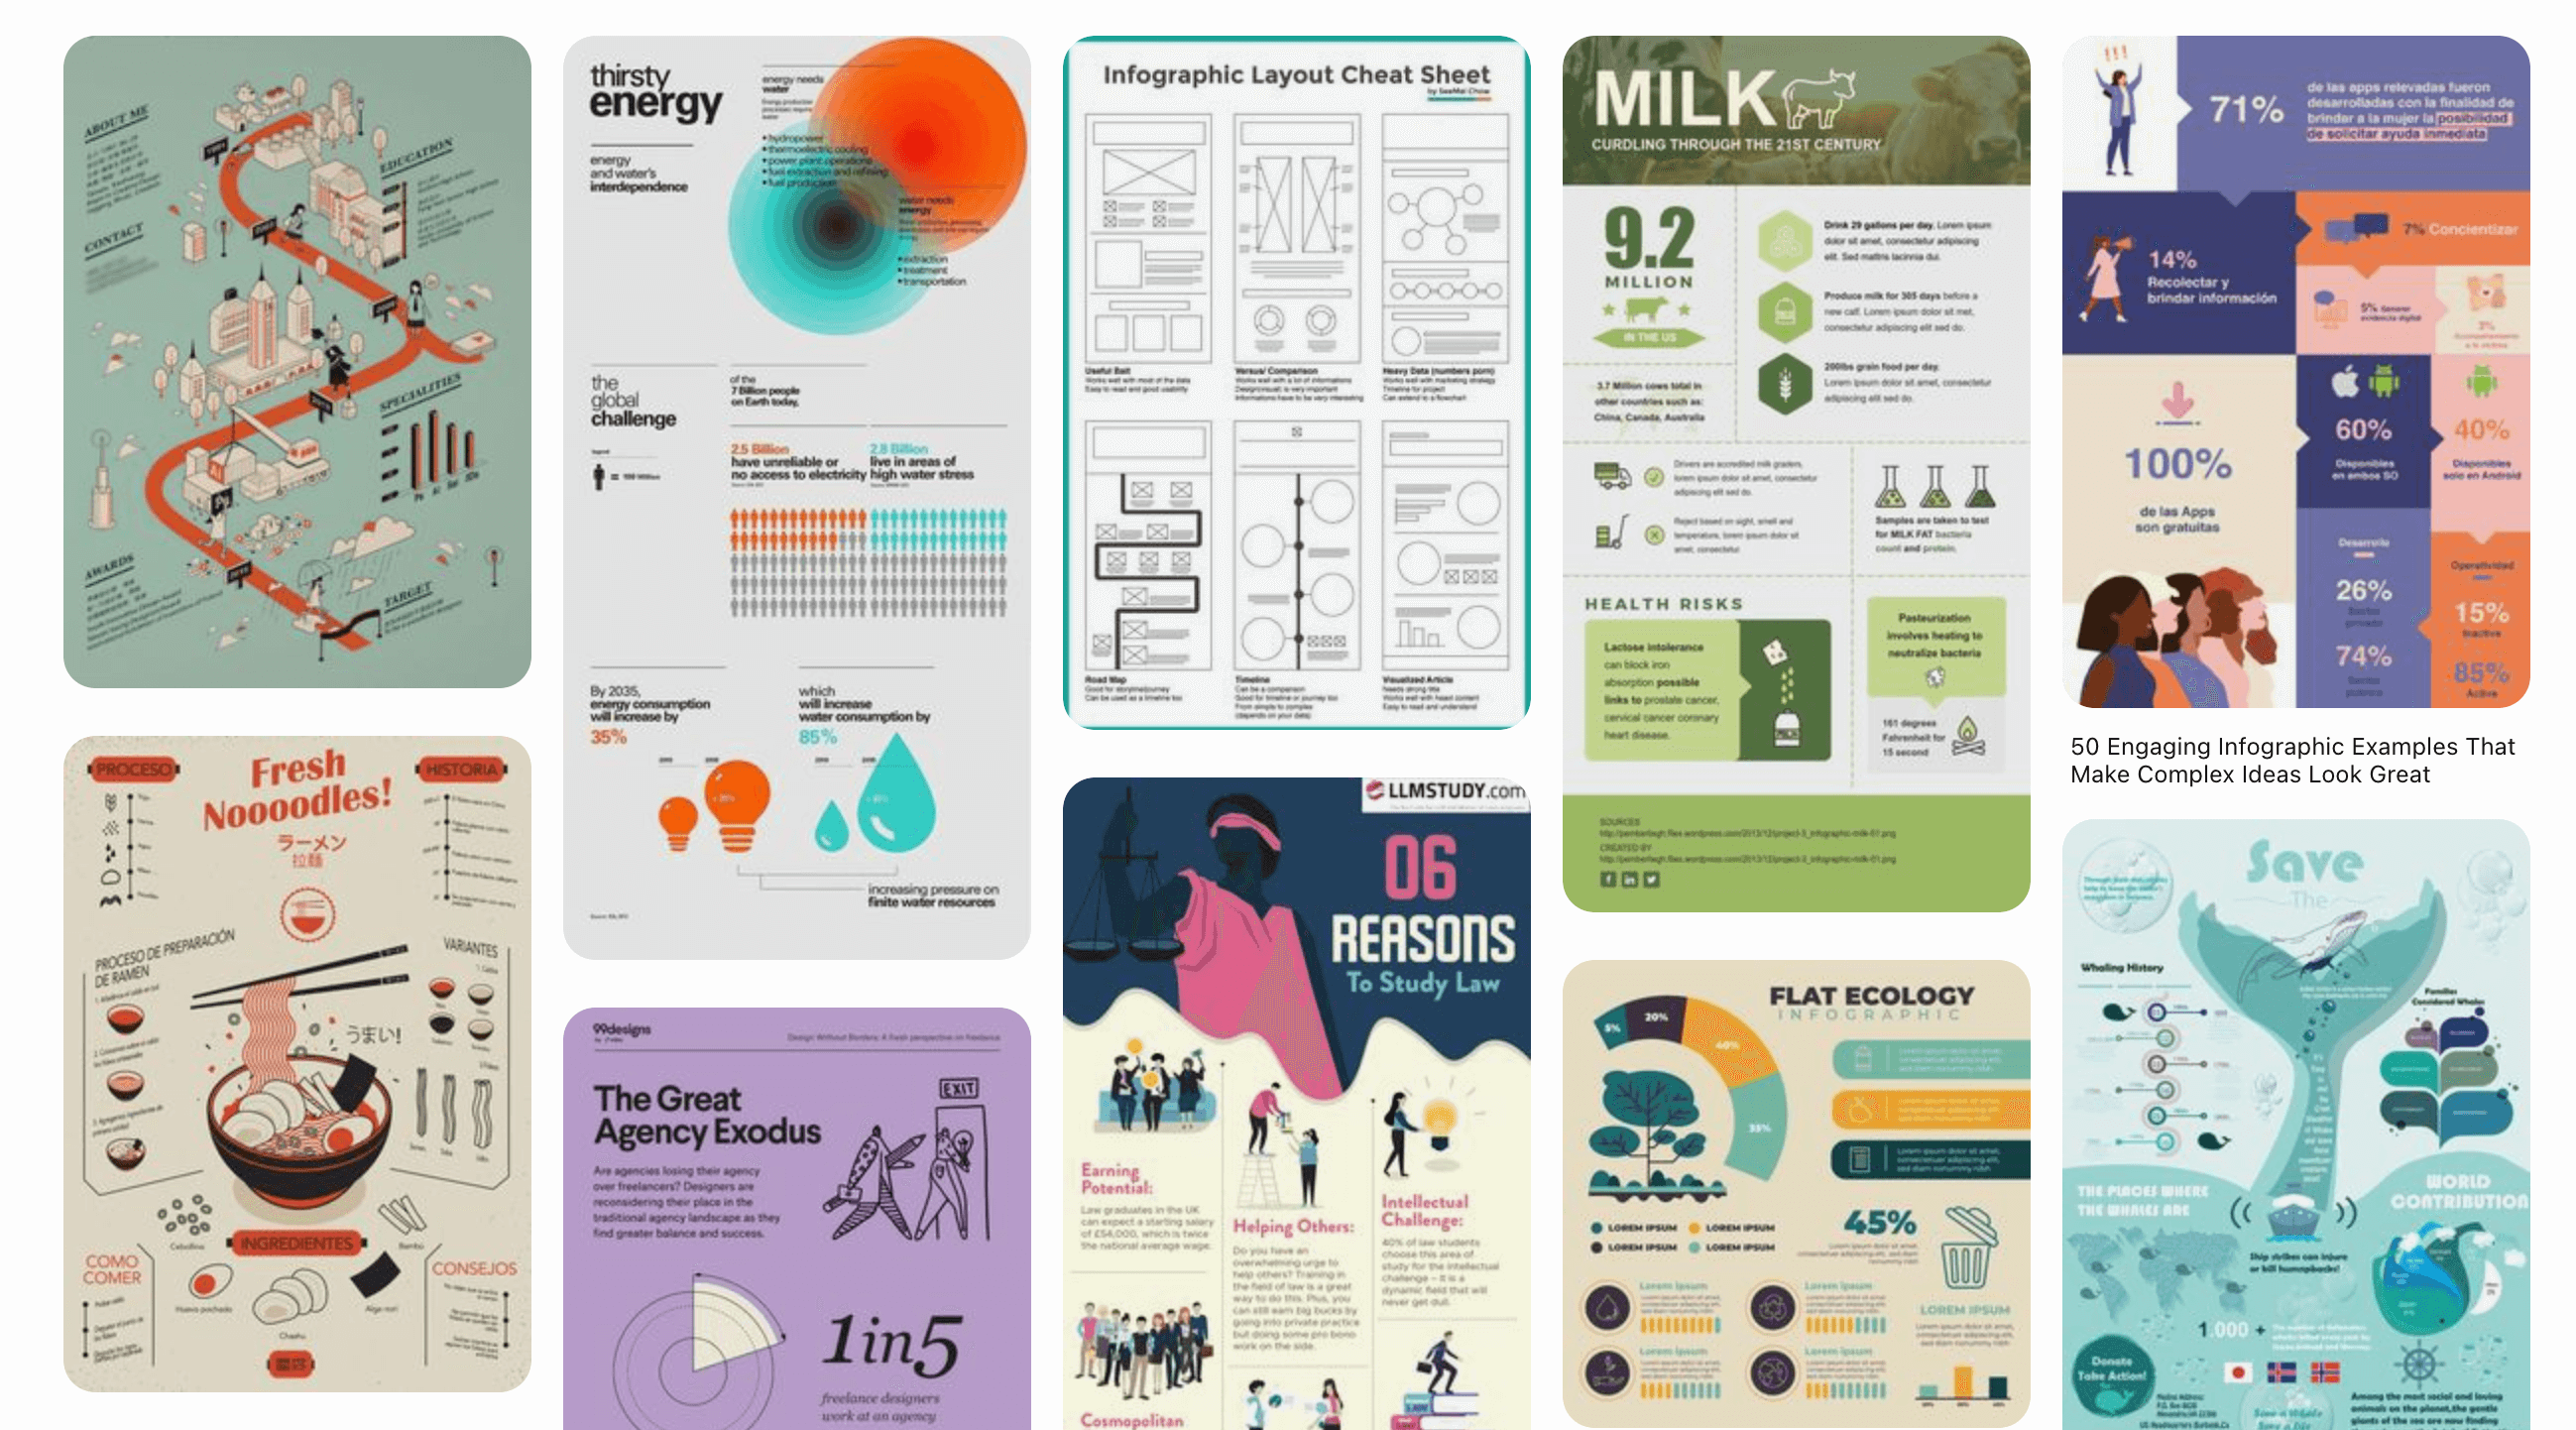
Infographics work in digital marketing for one simple reason: people remember pictures far better than words. In John Medina's Brain Rules, he summarizes the research like this: hear a piece of information and three days later you'll remember about 10 percent of it; add a picture and recall jumps to around 65 percent.
That memory gap is the whole business case. Here's what it means in practice, and how to make infographics that actually earn shares instead of sitting pretty.
What makes infographics so powerful?
They survive skimming. Most visitors scan, they don't read. An infographic delivers its core message to a skimmer in seconds, where a 1,500 word article delivers nothing.
They turn data into a story. A table of numbers asks the reader to do the work. An infographic does the work for them: it picks the comparison that matters and makes it visible. We covered the craft side of this in our post on data visualization.
They travel. A visual summary is far easier to repost, pin, and embed than a wall of text, which is why infographics keep showing up in other people's feeds and decks long after you published them.
One caution while we're here. You'll often see the claim that the brain processes visuals "60,000 times faster than text." Nobody has ever produced the study behind that number, so leave it out of your own marketing. The verified recall research above is impressive enough.
Why do infographics matter for SEO?
Not because Google reads the pixels. The SEO value comes from what people do with them:
- Backlinks. When a blogger or journalist embeds your infographic and credits the source, you earn a link. A genuinely useful infographic is one of the few assets strangers will link to voluntarily.
- Dwell time. Visitors spend longer on pages with a visual worth studying, a positive engagement signal.
- Keyword context. The surrounding copy, the file name, and the alt text give search engines something to index. Publish an infographic with a written summary underneath, never alone.
Are infographics actually effective, or just pretty?
They're effective when they carry real information. The ones that fail share a root cause: nothing worth remembering inside the graphics. What separates the workers from the wallpaper:
- One idea per infographic. "Everything about email marketing" becomes noise. "The 5 subject line patterns that get opened" gets saved.
- Real numbers, honestly sourced. Cite where every figure comes from, on the image itself. Credibility is the product.
- A narrative order. Top to bottom should answer: what's the problem, what does the data say, what should I do about it.
- Brand without billboard. Your colors, your type, a small logo. If the infographic reads as an ad, nobody shares it.
- Legible at feed size. Test it at phone width before publishing. If the labels blur, simplify.
Where do infographics fit in your marketing?
A single infographic can feed a month of channels:
- Blog post anchor. Publish it inside a written article so search engines have text to rank.
- Social cutdowns. Slice it into 3 or 4 single-stat tiles for LinkedIn and Instagram. Each tile links back to the full version. More on this in increasing social media engagement.
- Email. One section as a teaser image, with the full infographic as the click-through.
- Sales decks. The same visual, dropped into proposals, keeps your materials consistent.
- Outreach. Offer it to newsletters and blogs in your niche. This is where the backlinks come from.
If you want the longer list of use cases, we collected 22 reasons to use infographics in your business.
FAQ
How much does an infographic cost to produce?
Anywhere from free (Canva templates and your own time) to four figures for custom research and design. The data and the idea matter more than the budget: a plain chart of a surprising number beats a lavish illustration of an obvious one.
How long should an infographic be?
As short as the idea allows. A single strong statistic can be one tile; a process might need a tall scroll. When in doubt, cut sections until every element earns its pixels.
Do infographics still work with AI content everywhere?
Arguably better than before. Original data presented visually is exactly what generic AI text can't fake, and it's what readers and publishers now scan for.