
Fiverr
Custom analytics dashboard design for Fiverr's internal team: clean data visualization and actionable insights for creators.
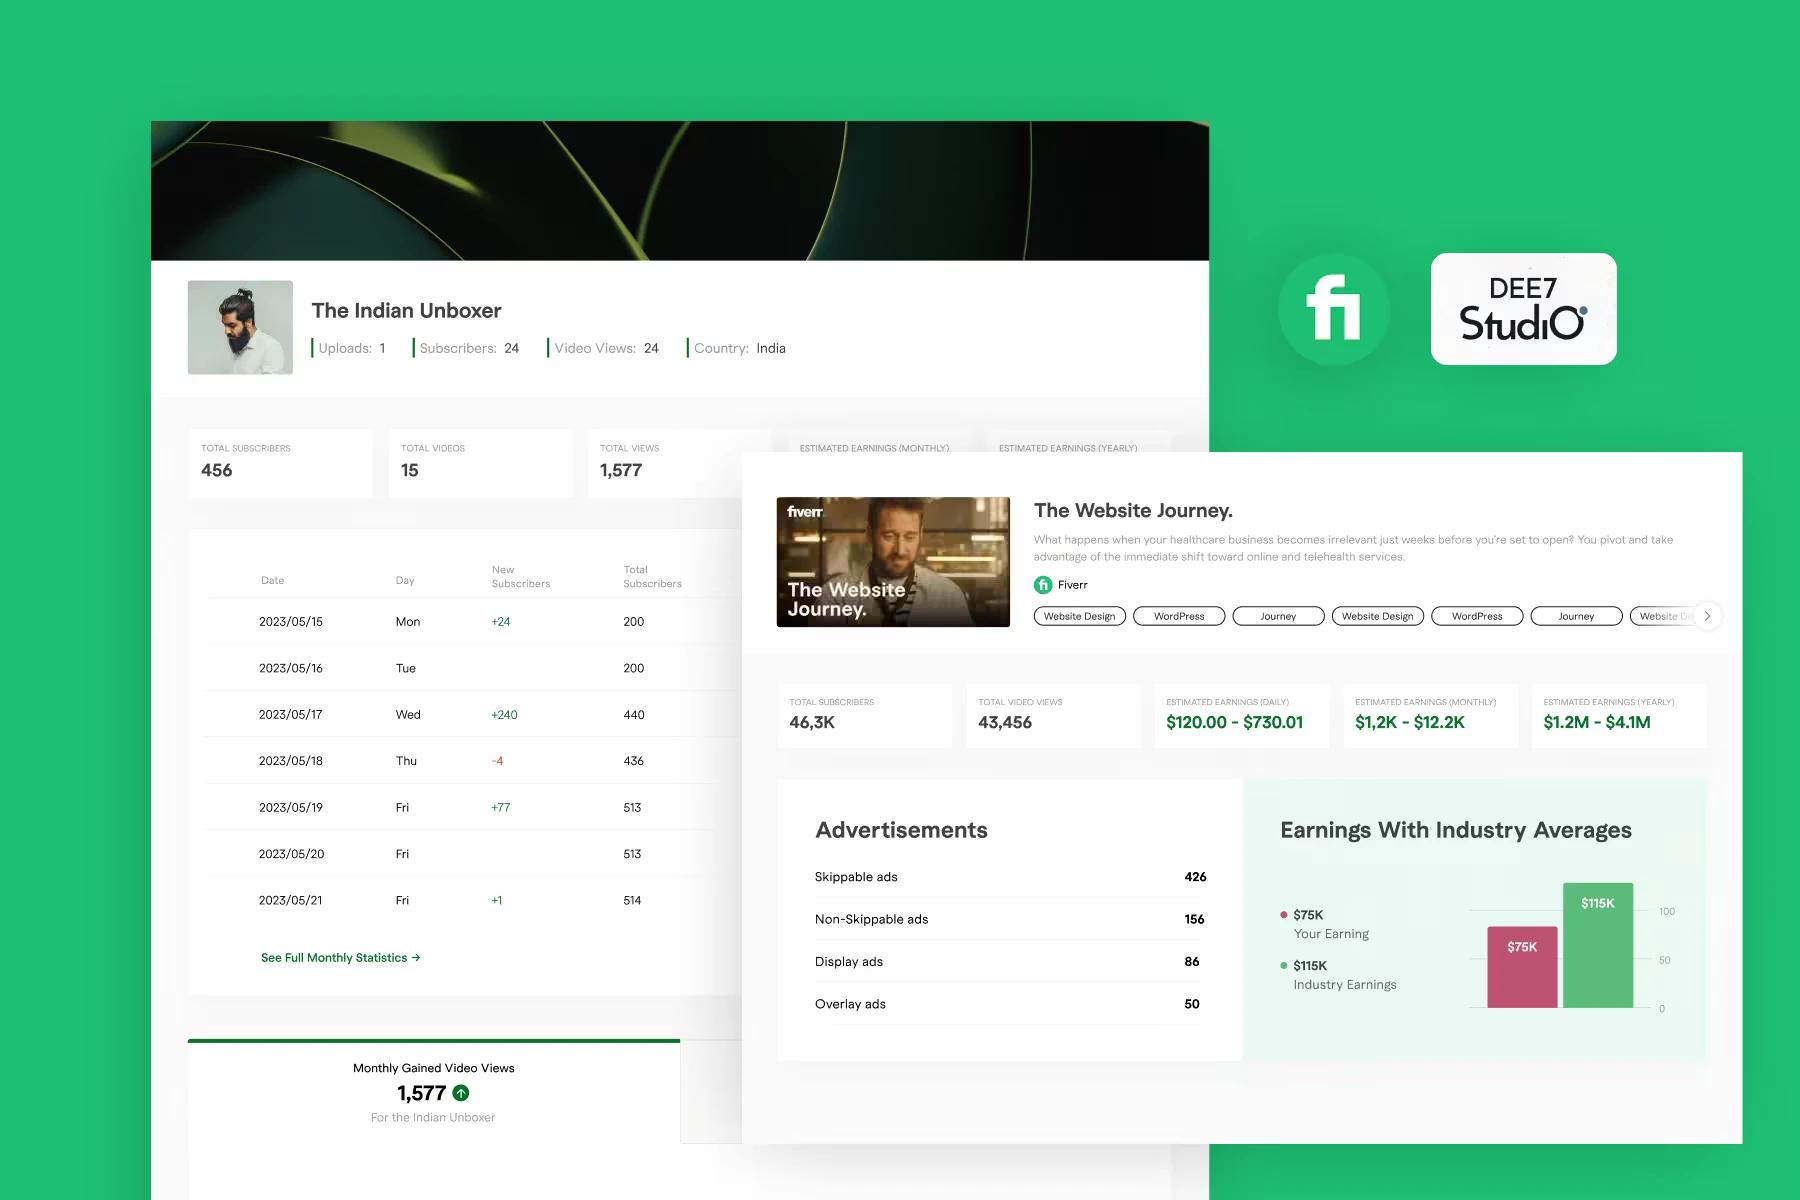
Fiverr's internal team needed an analytics dashboard for creators. We designed one: earnings, growth, and engagement data presented so a creator can read their numbers at a glance.
The challenge
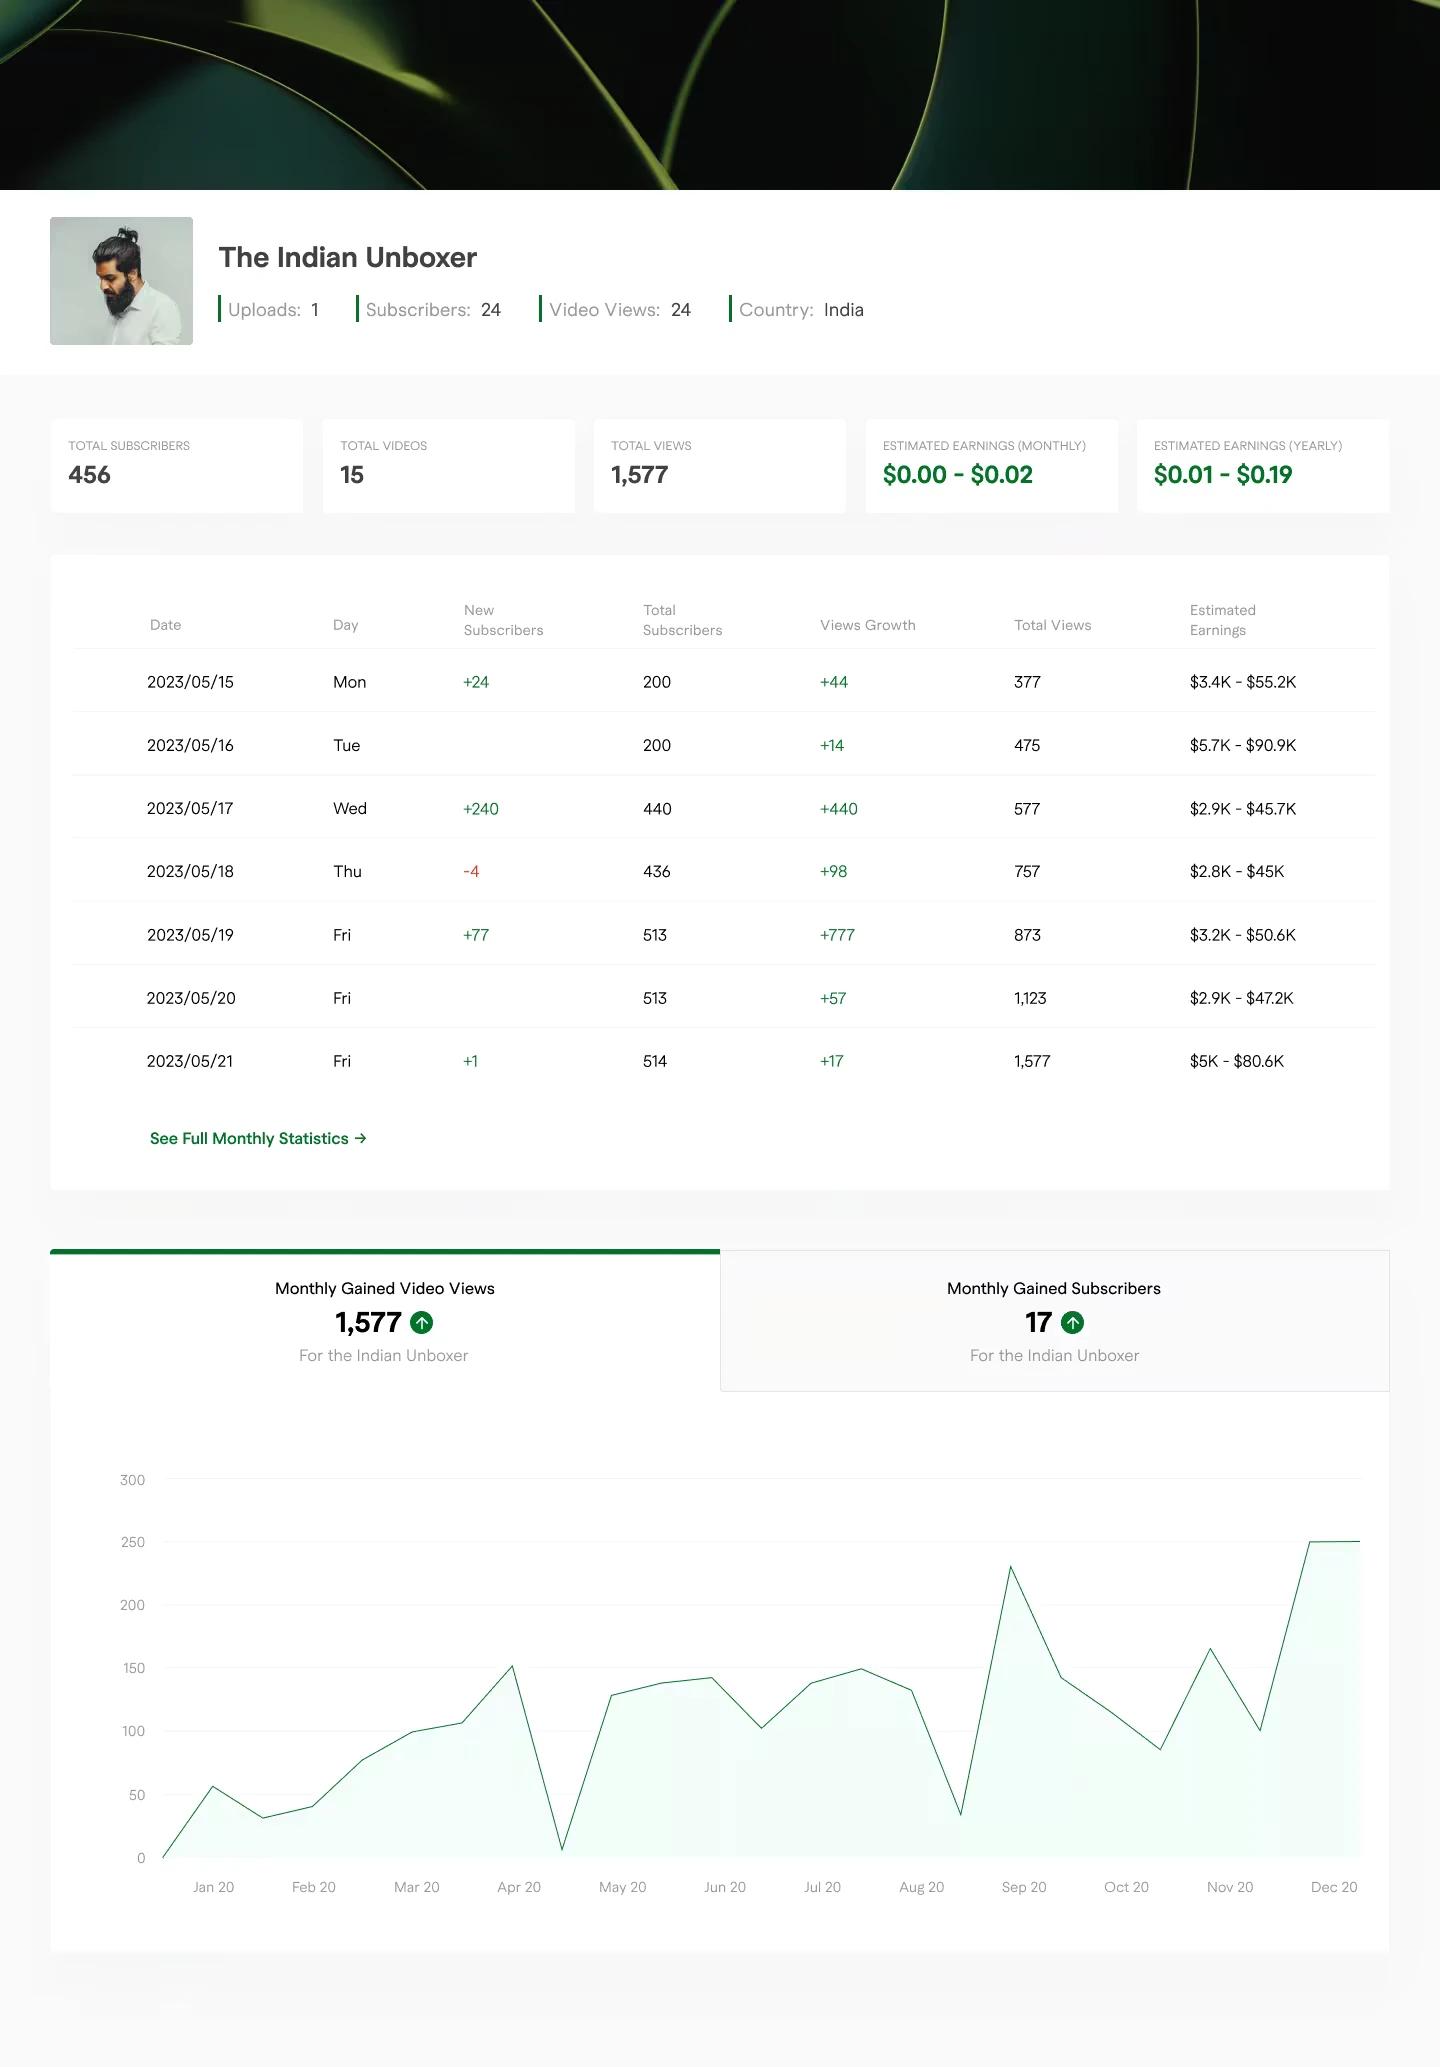
The existing interface was not doing the data justice. Key metrics like earnings, subscriber growth, and engagement patterns were there but hard to read, and complex creator data is easy to turn into an overwhelming wall of charts. The brief was clarity without dumbing anything down.
Our approach
We started from what creators actually need to see: real-time earnings, growth trends, and performance data they can act on. Everything else earns its place or gets cut. Visual hierarchy does the explaining, so the most important number on any screen is also the most prominent one, and related metrics live together instead of forcing the user to hunt across the interface.
Process
- Analyzed the pain points in Fiverr's existing analytics
- Designed a modular, card-based layout that scans in seconds
- Added color-coded growth indicators so up and down register instantly
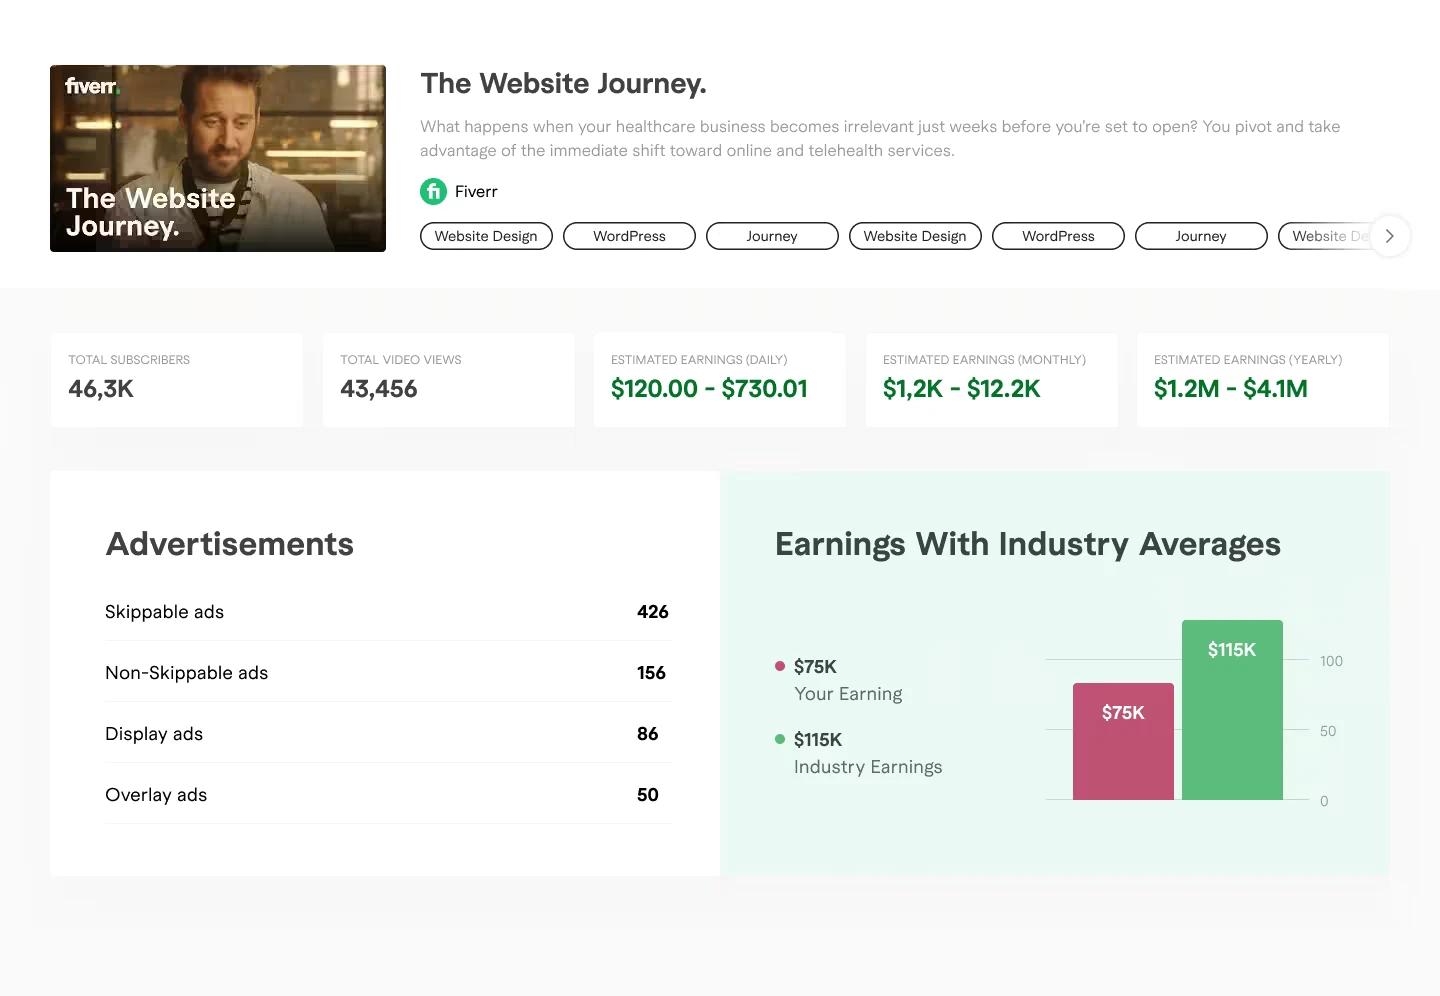
- Created comparison charts that put a creator's performance against industry averages
- Delivered a responsive design system with consistent typography and spacing
The result
A production-ready dashboard that Fiverr's team implemented for their PRO creators. Grouped metrics and a clear hierarchy mean less mental work to answer the question every creator opens the dashboard with: how am I doing?